 Acadia Learning brings scientists, teachers, and students together in partnerships that result in useful research and effective science education.
OVERVIEW
In the Northeastern US, it has been estimated that at least 75% of mercury arrives here from the atmosphere. This activity tracks that mercury back to one of its sources (electric utilities), using data collected by the US Environmental Protection Agency. The data are reports from various industries regarding how much mercury they emit. Ideally, students work in teams and contribute to a classroom map that will ultimately show where large and small mercury emitters are in the country. If appropriate this can also be an individual project, with each student filling in his or her own map (using markers or colored pencils). After the mapping exercise there should be a follow-up discussion about how mercury arrives in the Northeast. (The map will show low emissions in our region.) There is an optional math problem to tie the results to the amounts found in fish.
GETTING READY
Materials
- Three colors of sticky notes (like Post-Its) (red, yellow, blue or green would be ideal)
- A US Map (wall-map size)
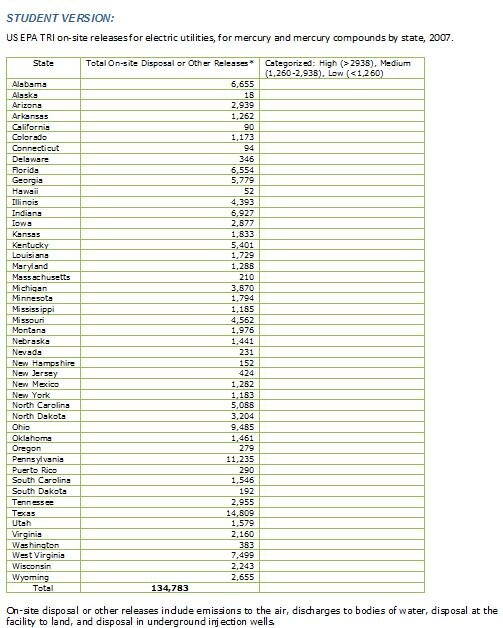
- Student versions of the EPA’s Mercury Release Table
Student Prerequisites
- How to measure volume and square inches
- Parts of a circle
- Proportions
- Averages
- Ranges
- Computer skills
- Library skills
ACTIVITY PROCEDURE
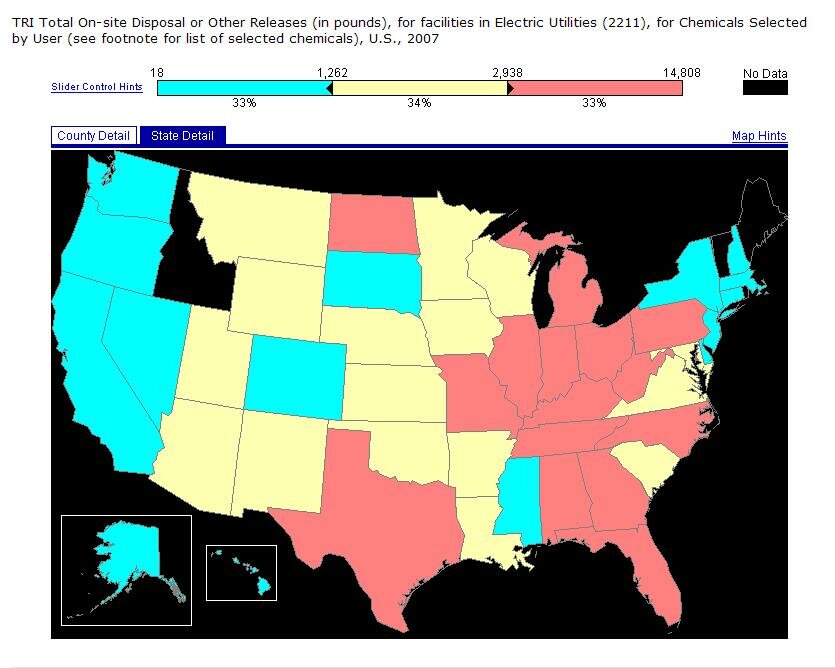
Divide students into three groups. Give each group a different colored pad of sticky notes. Have students categorize the “Total On-site Disposal or Other Releases” numbers in the third column, classifying the values as high, medium, or low as follows: High (>2938), Medium (1,260-2,938), Low (<1,260). Note: The categories are fairly arbitrary. They were chosen to split the data in thirds and were used on the EPA’s map.
Assign one group to each category. Then have students place their sticky notes on the map to show the geo-graphic distribution of mercury releases in the US. For example, a group with red sticky notes could be the “High” group and should place their stickies on the states that have high levels of releases (e.g., Alabama, Arizona, etc.).
When all the states have been categorized, lead a group discussion of any patterns in the data.
TEACHER VERSION: Map (produced by EPA) showing distribution of mercury emissions by state, using the same data set as in the table students will use. The students' map should look similar.
REFLECTION/FORMATIVE ASSESSMENT IDEAS
Which way does the wind blow?
Follow up with a discussion about prevailing winds in the Northeast, and how mercury is transported here in the atmosphere.
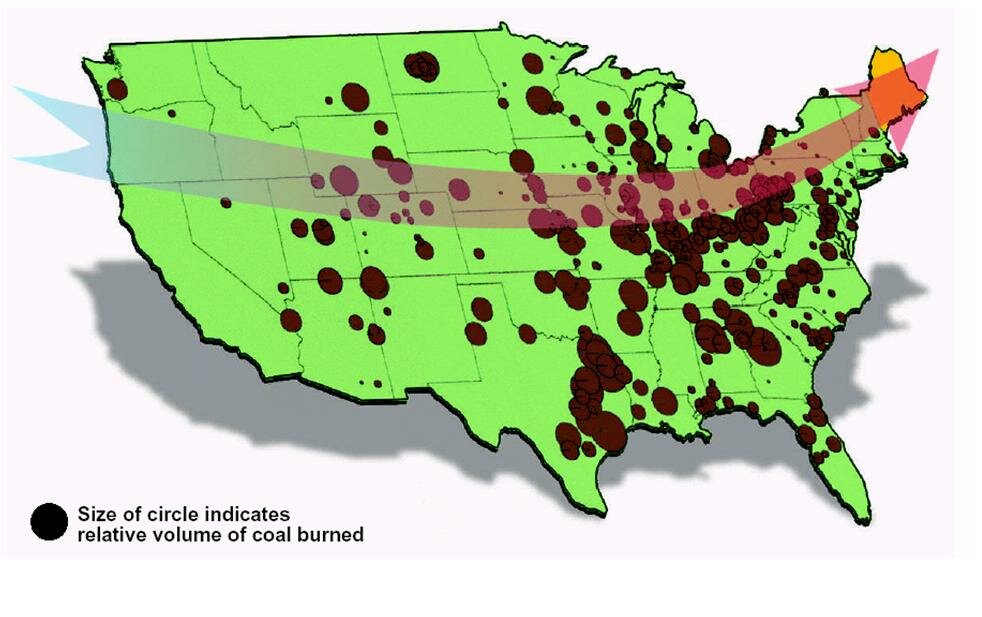
Answer: The graphic below is a visual demonstrating one way mercury is transported:
Spatial distribution of coal-fired plants and volume of coal burned (black dots) and predominant wind patterns in the conterminous United States.
EXTENSION IDEAS
The data we just worked with are reported in pounds of mercury. To reinforce the concept of scale and some math/unit conversions, students will determine how many POUNDS of mercury are in a fish.
Say a fish weighs 5 pounds. A pound is equal to 454 grams. Say that fish has a concentration of 300 ppb of mercury. One ppb is equal to one nanogram per gram. So the fish has 300 nangograms of mercury per gram of fish weight. Now – how many pounds of mercury are in the fish?
Answer: the fish weighs 5 lb x 454 g/lb = 2,270 grams. There are 300 nanograms mercury per gram of fish. So 300 ng/g (mercury mass) x 2,270 g (fish mass) = 681,000 ng of mercury in the whole fish. You can factor out 1,000 by converting to micrograms and say the fish contains 681 ug of mercury. How many pounds is 681 ug? Well, multiply: 681 ug x 1 mg/1000 ug x 1 g/1000 mg and you get 0.000681 grams. Now convert to pounds: 0.000681 g x 1 lb/2,270 g = 0.0000003 lbs. You would need over 3.3 million fish to gather together a pound of mercury.
TEACHER'S CHEAT SHEET
Completed teacher version of EPA's Mercury Release Table
HANDOUTS
Student version of EPA's Mercury Release Table
RESOURCES
All data regarding mercury releases in this activity were gathered from the US EPA’s TRI explorer, and are 2007 data, accessed August 18, 2009.
Main TRI web site:
Online tutorial for further investigation:
Map courtesy of Portland Press Herald, Portland, Maine, USA. Source: United States Energy Information Administration, E-3 Ventures (USDOE, 1999), adapted from Bank et al. 2005.